Error Analysis#
The extraction and analysis of the error on the test set is essential for evaluating the performance of the neural network models. DeepH-dock provides a miscellaneous tool for error statistics and visualization. The tool takes the inference result \(H^{\text{pred}}\) and benchmark data \(H^{\text{bm}}\), and then calculates the error between them.
dock analyze error -h
Usage: dock analyze error [OPTIONS] COMMAND [ARGS]...

Options:
  -h, --help  Show this message and exit.

Commands:
  element            Element distribution analysis (from inference results).
  element-logfile    Element distribution analysis (from training log file).
  element-pair       Element pair distribution analysis.
  entries            Error distribution for each entries with scatter figure.
  orbital            Error distribution for each elements orbital pair.
  structure          Structure distribution analysis (from inference results).
  structure-logfile  Structure distribution analysis (from training log file).
Several kinds of error measures are provided:
“entries” for error of matrix entries with scatter visualization.
“orbital” for error of each orbital pair with chessboard-like visualization.
“element-pair” for error of each element pair with chessboard-like visualization.
“element(-logfile)” for error decomposed on each element with periodic table visualization.
“structure(-logfile)” for error of each structure with distribution visualization.
The commands without the -logfile suffix are normal modes that calculate the error between the inference result and the benchmark data. For these modes, user needs to provide PREDICTED_DFT_DIR and BENCHMARK_DFT_DIR which contain the inference result and the benchmark data respectively.
The commands with the -logfile suffix extract the error from the test-step information in the deepx.log file. These modes give the same result as normal modes but the extractions are much faster. These modes only works when a training process with log_level = "debug" is performed and user needs to provide the path of the deepx.log file.
Note: The averaged error from different modes are usually different because of the different methods to taking the average.
Basic arguments#
Basic arguments for all the commands:
Usage: dock analyze error [COMMAND] [OPTIONS] PREDICTED_DFT_DIR

Options:
  -b, --benchmark-dft-dir, --bm DIRECTORY
                                  Path of the benchmark DFT data directory. If not provided, it will be set as `predicted_dft_dir`.  [default: ""]
  --target [H|Rho]                The target in the benchmark DFT data directory: "H" for hamiltonian.h5. "Rho" for density_matrix.h5.  [default: H]
  --not-standardize-gauge         Whether to use overlap to correct the chemical potential.
  --ignore-overlap-mask           Whether to ignore the overlaps value mask.
  --cache-res                     Cache the analysis results.
  -j, --jobs-num INTEGER      The number of parallel processes.  [default: 1]
  -t, --tier-num INTEGER          The tier number of the source data, -1 for <source>, 0 for <source>/<data_dirs>, 1 for <source>/<tier1>/<data_dirs>, etc.  [default: 0]
  --plot-dpi, --dpi INTEGER       The plot figure DPI.  [default: 300]
  --data-split-json PATH          The data split json file that indicate which belongs to train, validate, and test.
  --data-split-tags TEXT          The data split tags that indicate use which data set to analysis.  [default: train,validate,test]
For functionals with non-local potentials such as hybrid functionals, the cutoff range of Hamiltonian is larger than that of overlap matrix, so that --ignore_overlap_mask should be used to include the error of all the Hamiltonian matrix elements.
By default, the energy gauge difference between the predicted and benchmark Hamiltonian is ruled out, which means that \(H\) and \(H + \Delta \mu S\) are considered as the same Hamiltonian. For systems where the gauge variation across different structures are crucial, the model should be trained with standardize_gauge = false. To include the gauge difference into the error statistics, the option --not_standardize_gauge should be used. The same treatment applies to the density matrix training, where the gauge has no meaning.
The raw data of the error can be dumped by --cache_res for subsequent usage.
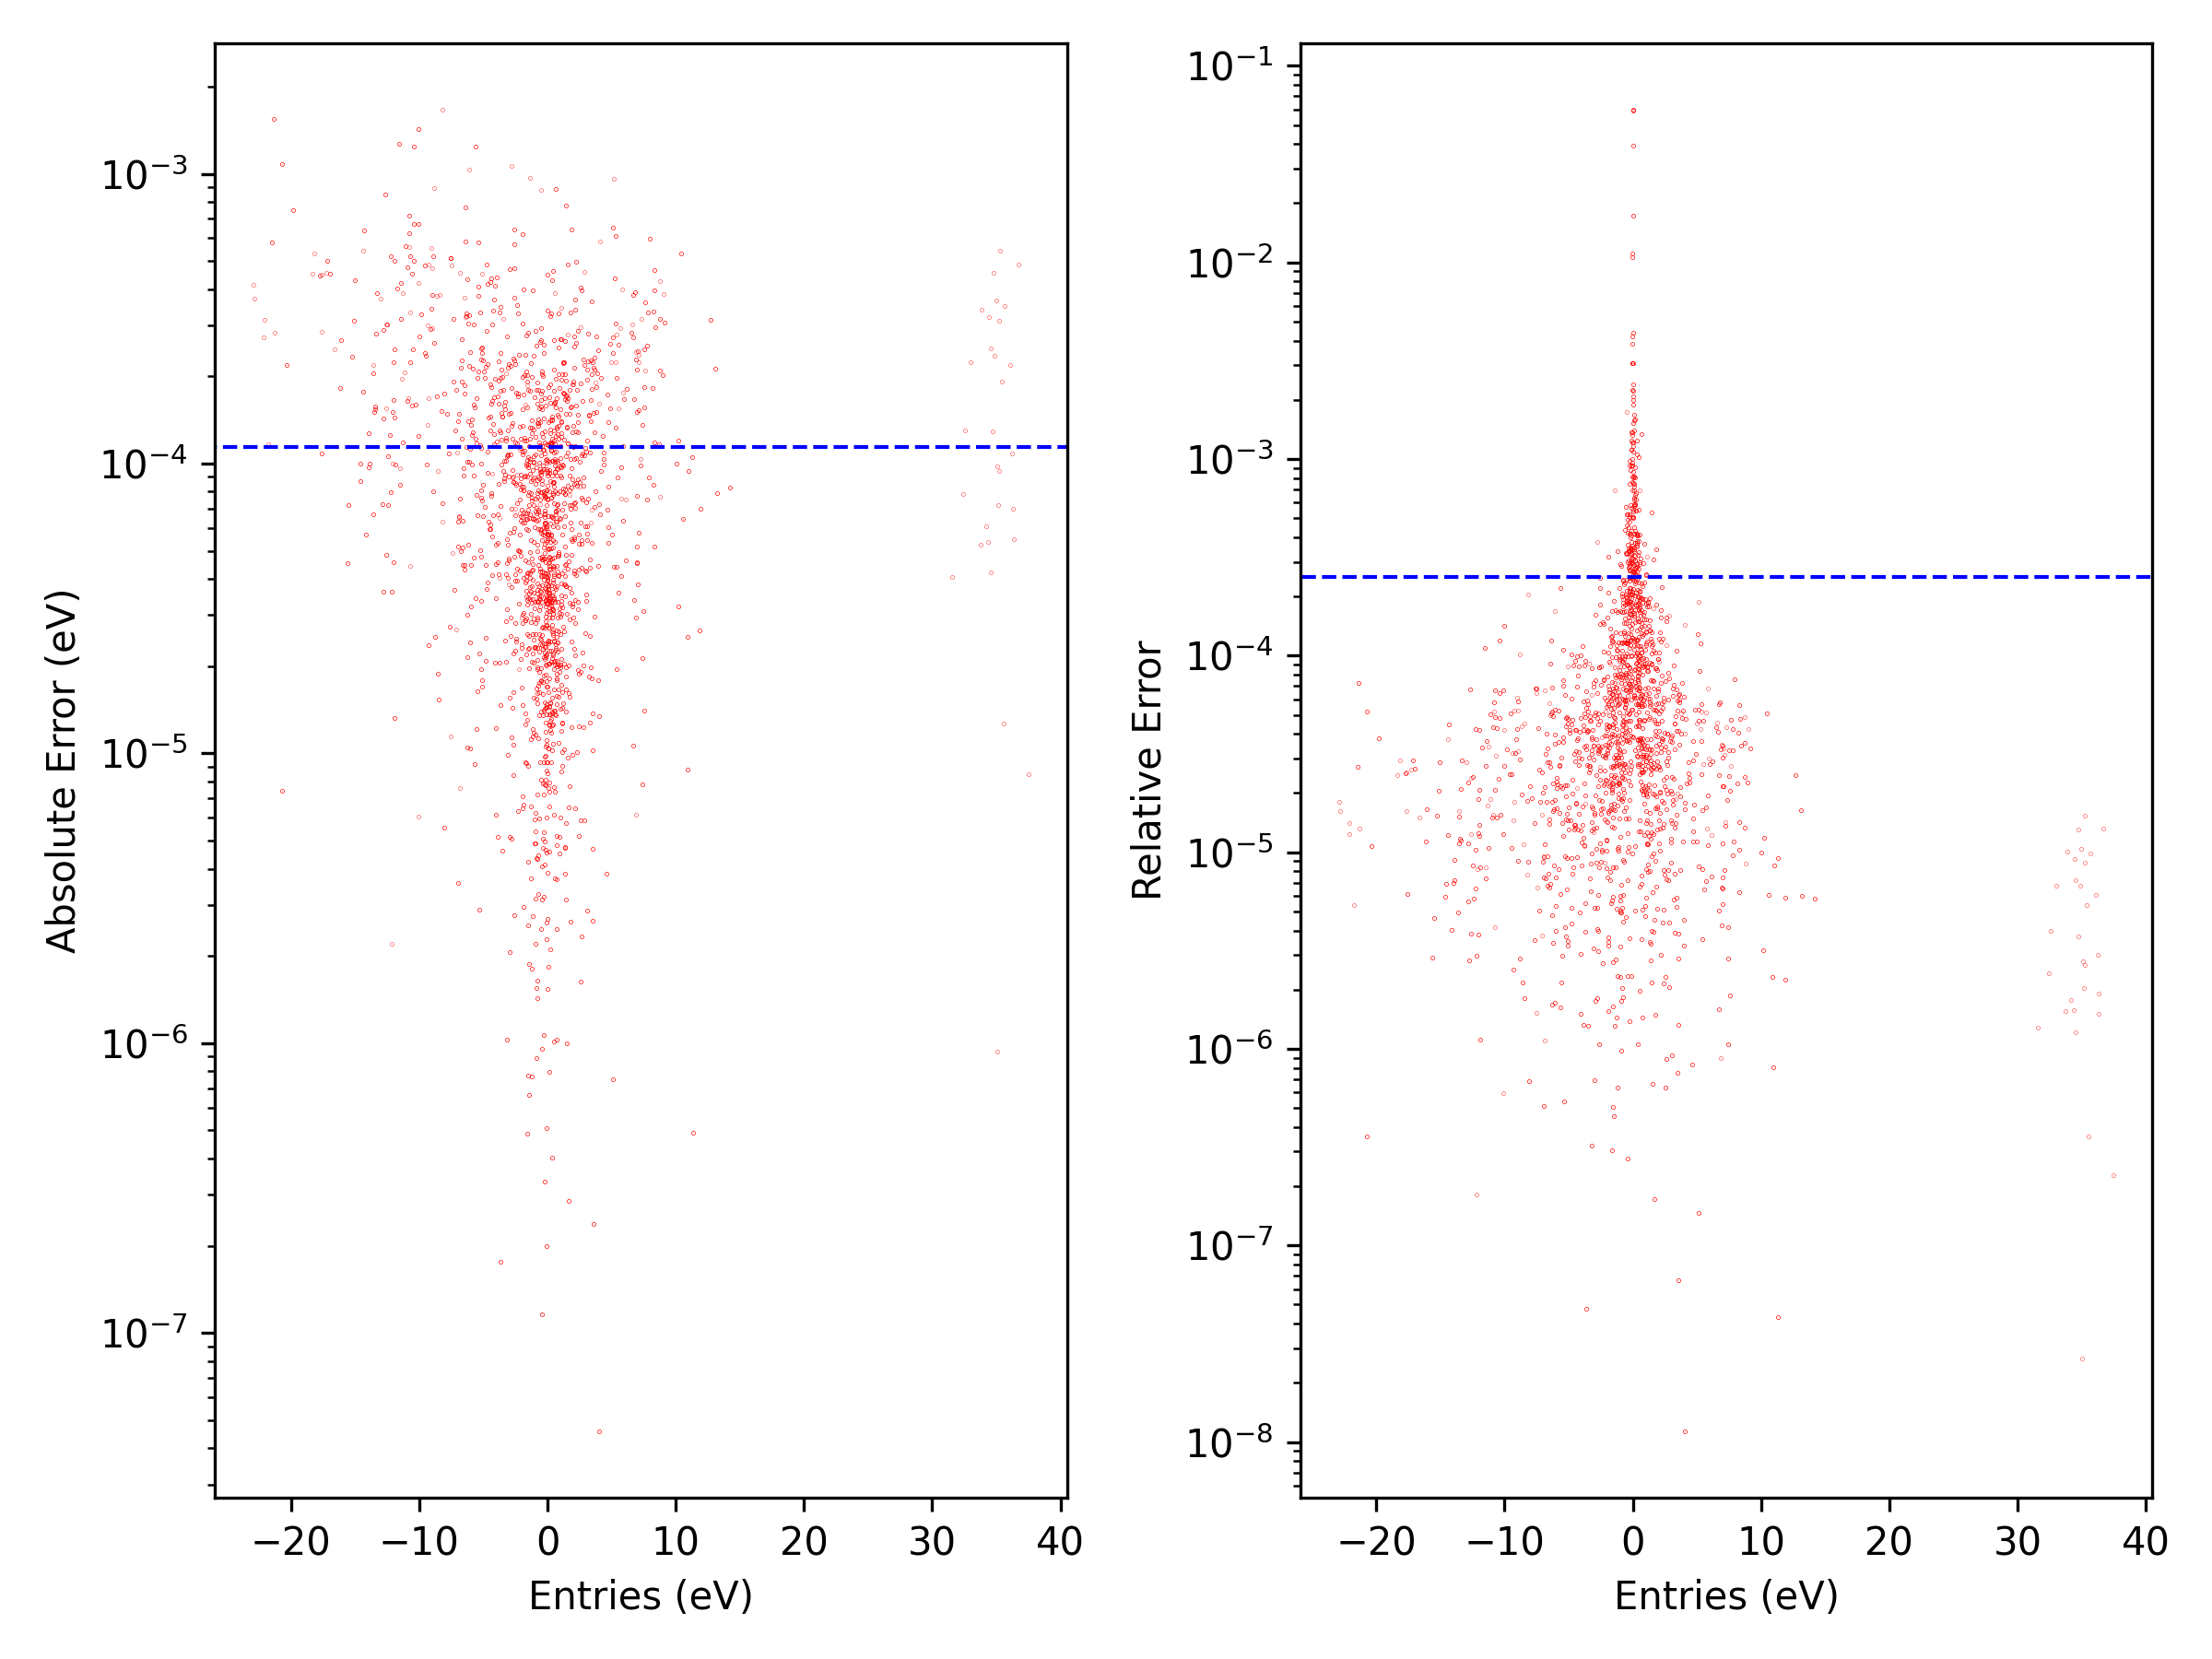
Entries error#
Calculate and visualize the error of all the matrix entries.
dock analyze error entries -h
Usage: dock analyze error entries [OPTIONS] PREDICTED_DFT_DIR

  Error distribution for each entries with scatter figure.

Options:
  [BASIC_OPTIONS]                 Please refer to `Basic arguments` for details.
  --entries-range, --xlim <FLOAT FLOAT>...
                                  The range of entries to analysis and show.
  --entries-abs-err-range, --y1lim <FLOAT FLOAT>...
                                  The range of absolute error to analysis and show.
  --entries-rel-err-range, --y2lim <FLOAT FLOAT>...
                                  The range of relative error to analysis and show.
  --plot-heatmap, --heatmap       Enable the heatmap mode for error distribution.
  --heatmap-bucket-size INTEGER   The bin (bucket) size for heatmap error distribution.  [default: 500]
  -h, --help                      Show this message and exit.
Example:
dock analyze error entries ./infer/dft -b ./benchmark.bak/dft -t 0 -j 4 --cache-res
Error Analysis: 6it [00:00, 836.05it/s]
[info] Entries mean absolute error: 1.137e-04 eV
[info] Entries mean relative error: 2.503e-04
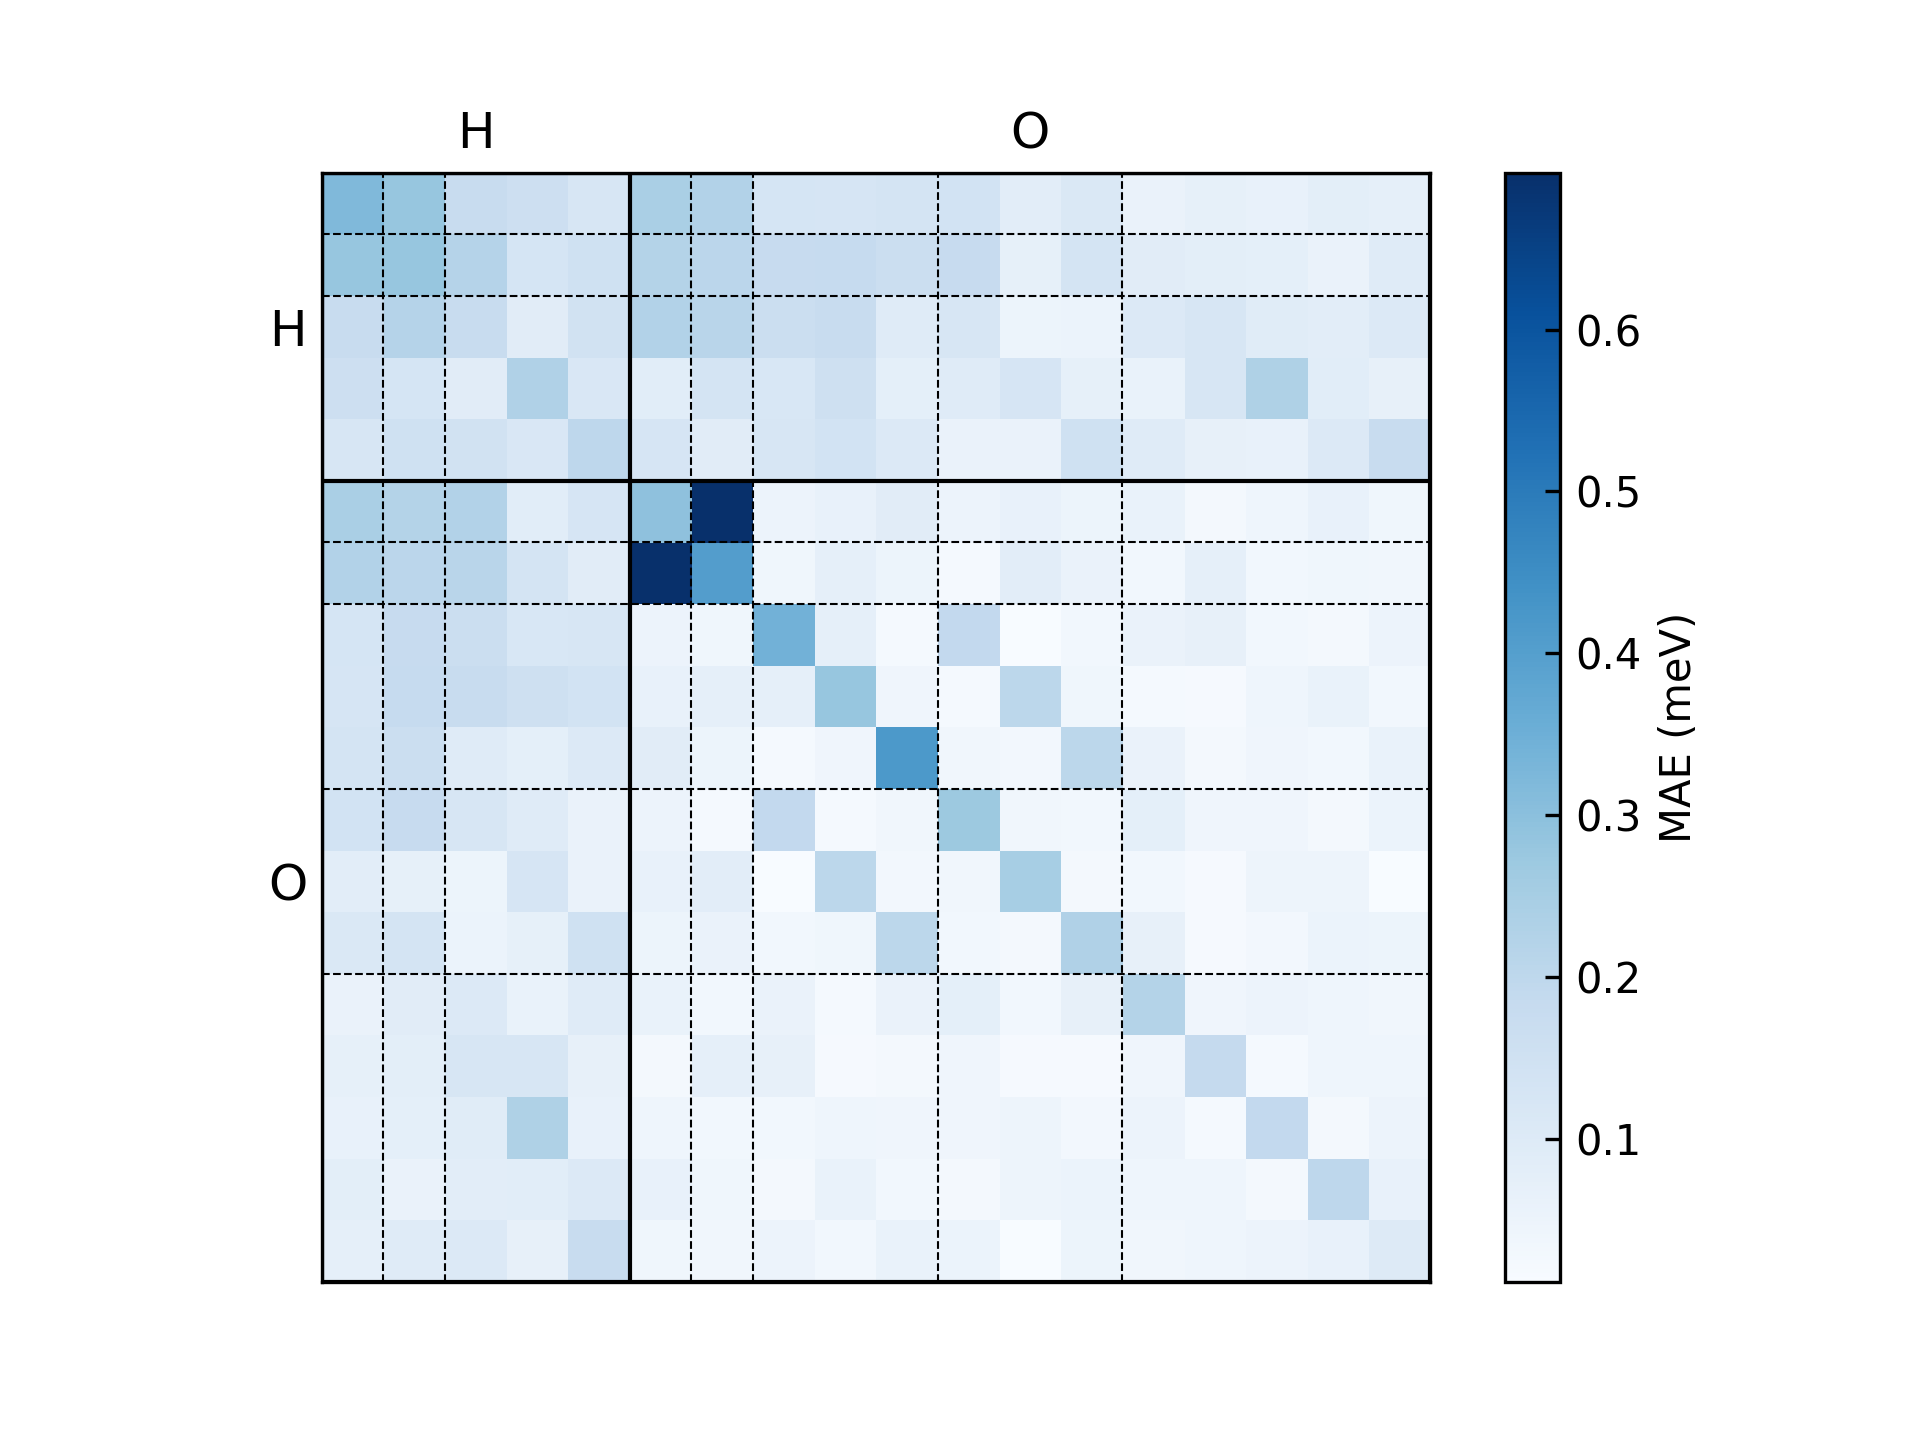
Orbital error#
Calculate and visualize the error decomposed on orbital pairs.
dock analyze error orbital -h
Usage: dock analyze error orbital [OPTIONS] PREDICTED_DFT_DIR

  Error distribution for each elements orbital pair.

Options:
  [BASIC_OPTIONS]                 Please refer to `Basic arguments` for details.
  --pred-only                     Only analysis the predicted Hamiltonian, which means we will show the value
                                  distribution of `abs(H_pred)` instead `abs(H_pred - H_bm)`.
  --onsite-only                   Only analysis the onsite (self atom loop) values.
  --plot-z-range, --zrange <FLOAT FLOAT>...
                                  The lower and upper limit for plotting color map.
  --log-scale                     Plot using the log scale.
  -h, --help                      Show this message and exit.
Example:
dock analyze error orbital ./infer/dft -b ./benchmark.bak/dft -t 0 -j 4 --cache-res
Error Analysis: 6it [00:00, 865.55it/s]
[info] Orbital average error: 9.821e-05 eV
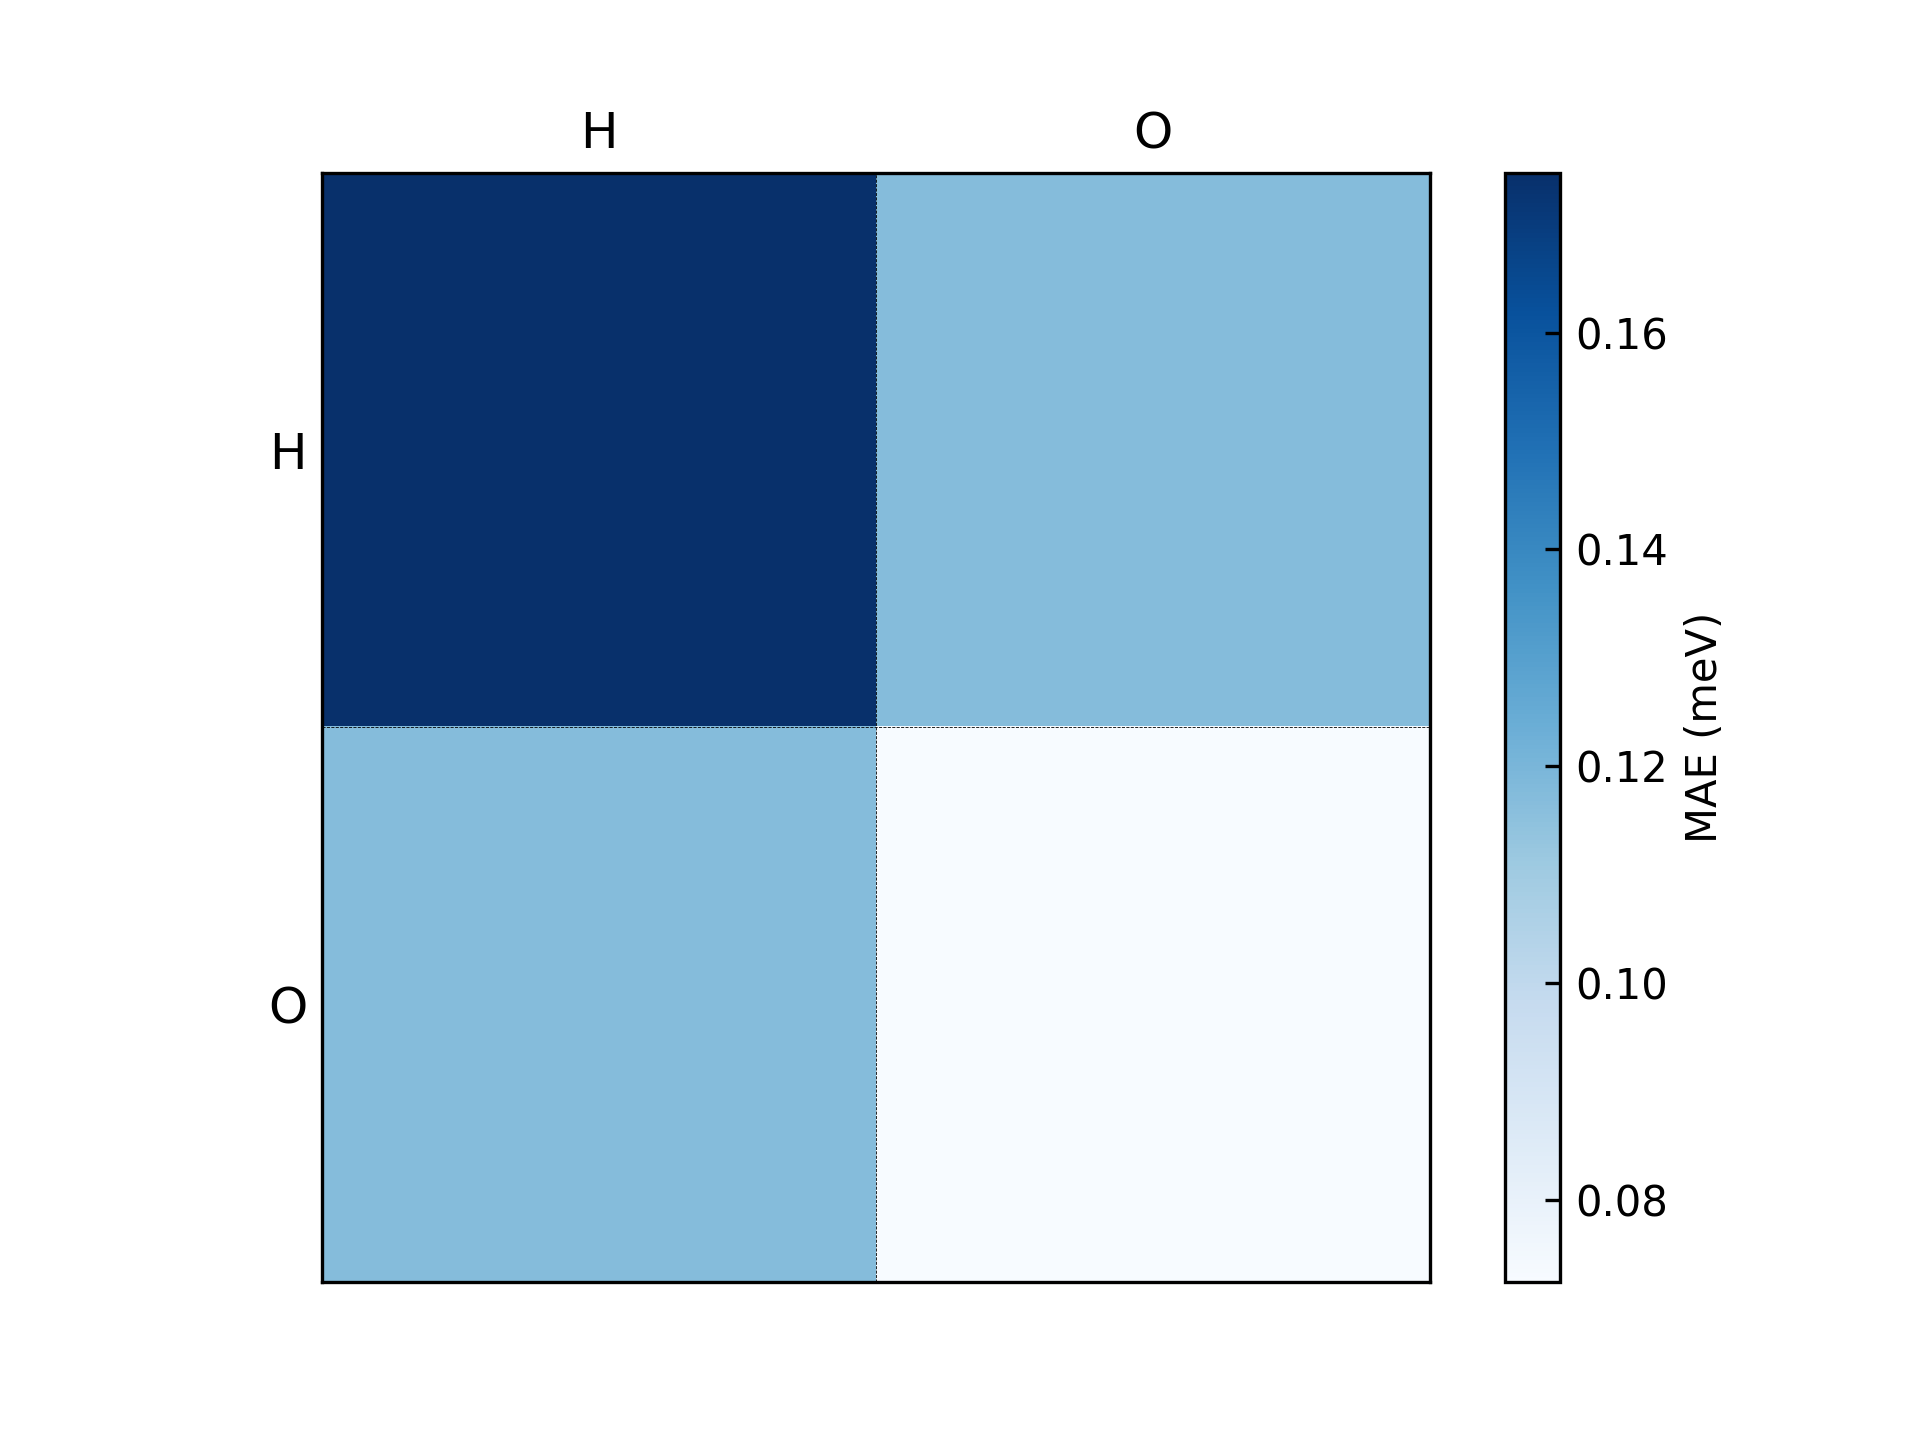
Element-pair error#
Calculate and visualize the error decomposed on element pairs.
dock analyze error element-pair -h
Usage: dock analyze error element-pair [OPTIONS] PREDICTED_DFT_DIR

  Element pair distribution analysis.

Options:
  [BASIC_OPTIONS]                 Please refer to `Basic arguments` for details.
  --pred-only                     Only analysis the predicted Hamiltonian.
  --onsite-only                   Only analysis the onsite (self atom loop) values.
  --plot-z-range, --zrange <FLOAT FLOAT>...
                                  The upper limit for plotting color map.
  --log-scale                     Plot using the log scale.
  -h, --help                      Show this message and exit.
Example:
dock analyze error element-pair ./infer/dft -b ./benchmark.bak/dft -t 0 -j 4 --cache-res
Error Analysis: 6it [00:00, 248.94it/s]
[info] Elements-pair average error: 1.203e-04 eV
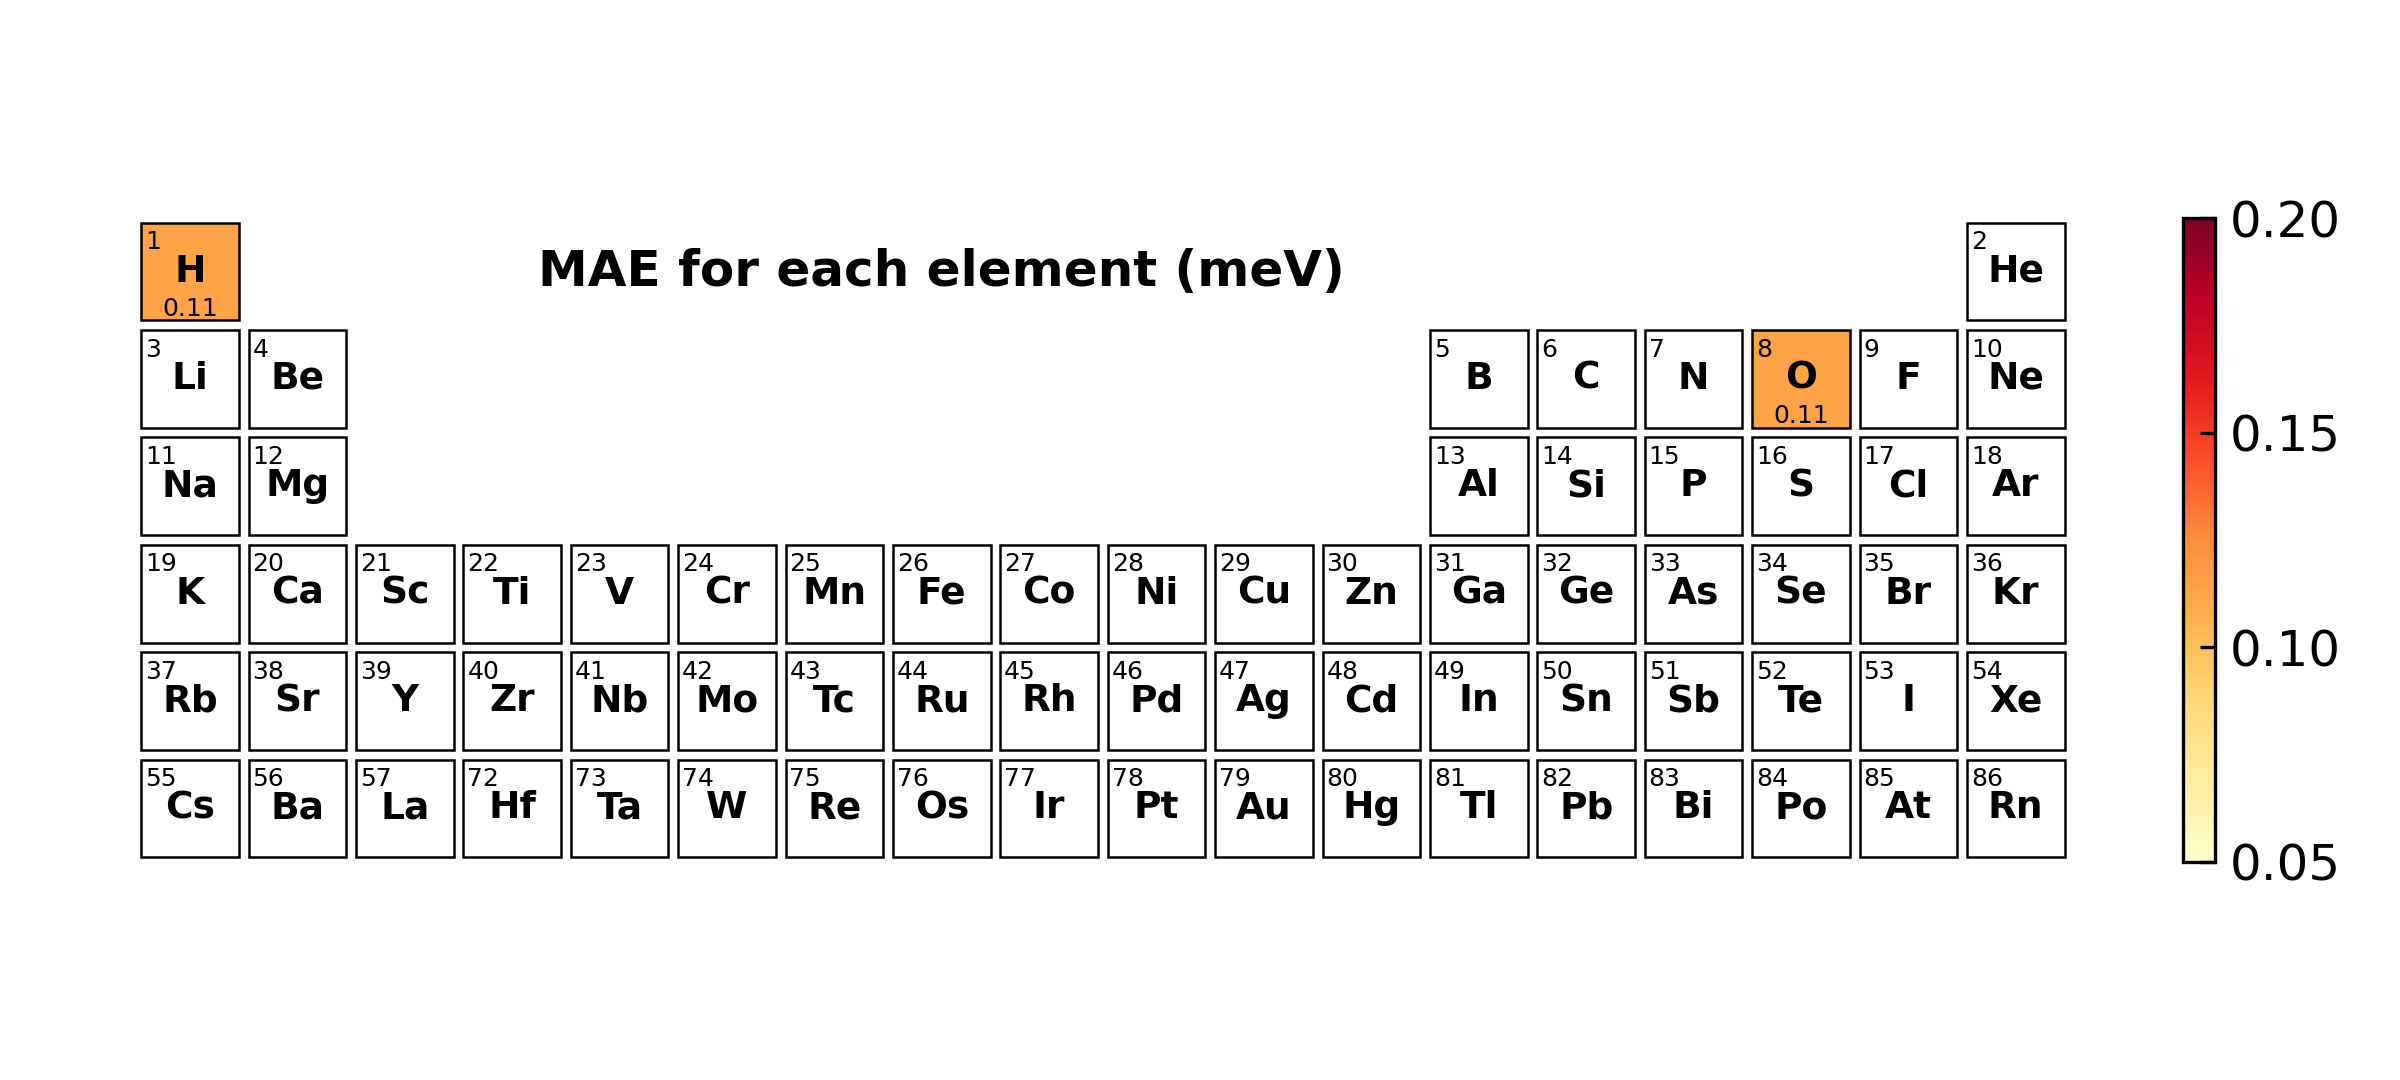
Element error#
Calculate and visualize the error decomposed on each element.
dock analyze error element -h
Usage: dock analyze error element [OPTIONS] PREDICTED_DFT_DIR

  Element distribution analysis (from inference results).

Options:
  [BASIC_OPTIONS]                 Please refer to `Basic arguments` for details.
  --plot-elem-range, --E-range <FLOAT FLOAT>...
                                  The range of energy error to analysis and show.  [default: 0.2, 1.0]
  -h, --help                      Show this message and exit.
Example:
dock analyze error element ./infer/dft -b ./benchmark.bak/dft -t 0 -j 4 --cache-res --E-range 0.05 0.2
Error Analysis: 6it [00:00, 17.87it/s]
[info] Elements average error: 1.137e-04 eV
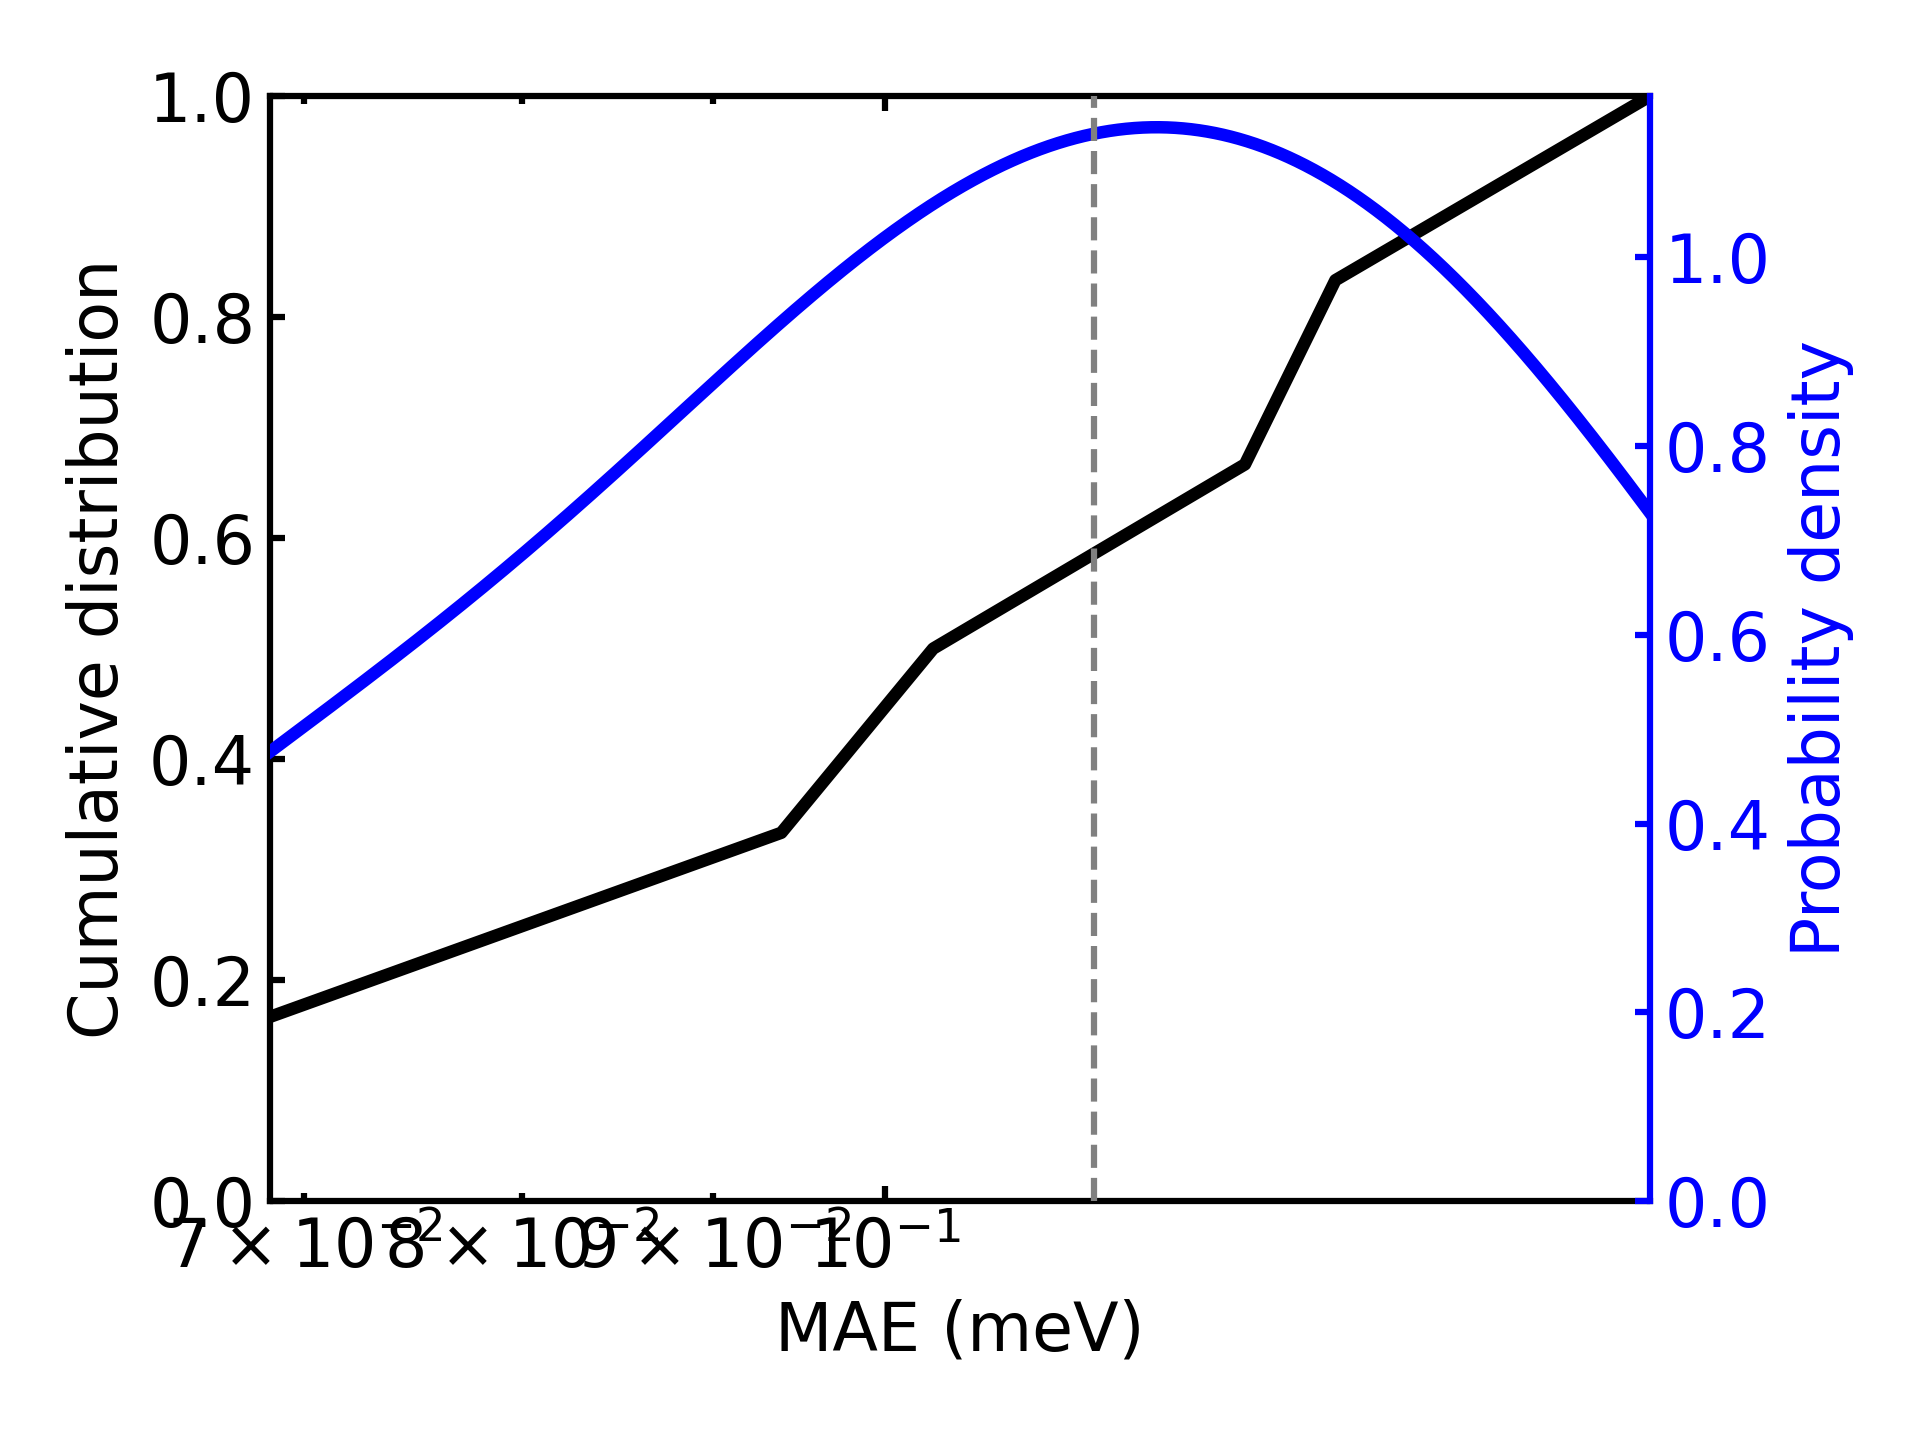
Structure error#
Calculate and visualize the averaged error of each structure.
dock analyze error structure -h
Usage: dock analyze error structure [OPTIONS] PREDICTED_DFT_DIR

  Structure distribution analysis (from inference results).

Options:
  [BASIC_OPTIONS]                 Please refer to `Basic arguments` for details.
  --xlims <FLOAT FLOAT>...        The range of energy error to analysis and show.
  --ylims <FLOAT FLOAT>...        The range of density to analysis and show.
  -h, --help                      Show this message and exit.
Example:
dock analyze error structure ./infer/dft -b ./benchmark.bak/dft -t 0 -j 4 --cache-res
Error Analysis: 6it [00:00, 23.12it/s]
[info] Structures average error: 1.137e-04 eV